HealthJoy | Product Design | 2020
HealthJoy Dashboard
Providing customers a streamlined and simple enrollment process, real-time reporting, and education opportunities.
Designing the Boring
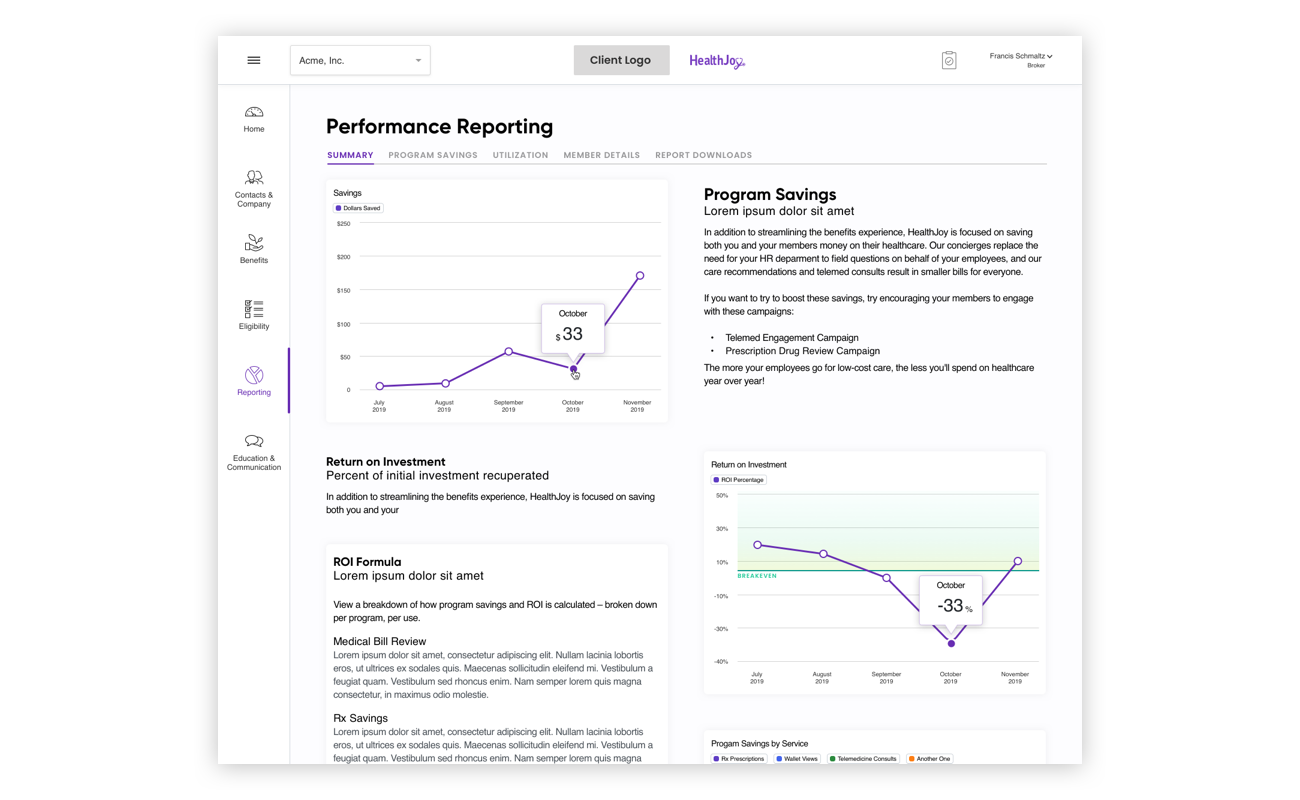
How do you make benefits utilization exciting? Can you? Well, for the first few weeks at HealthJoy I was aiming to solve the impossible: turn the data for companies' benefits utilization into pleasantly digestible reporting.
This project started with UX testing and feedback review, then white-boarding sessions, UI feedback, and quick HTML prototypes to explain interaction models to engineers and stakeholders, and then high-fidelity mocks and prototypes for final handoff.
The Process
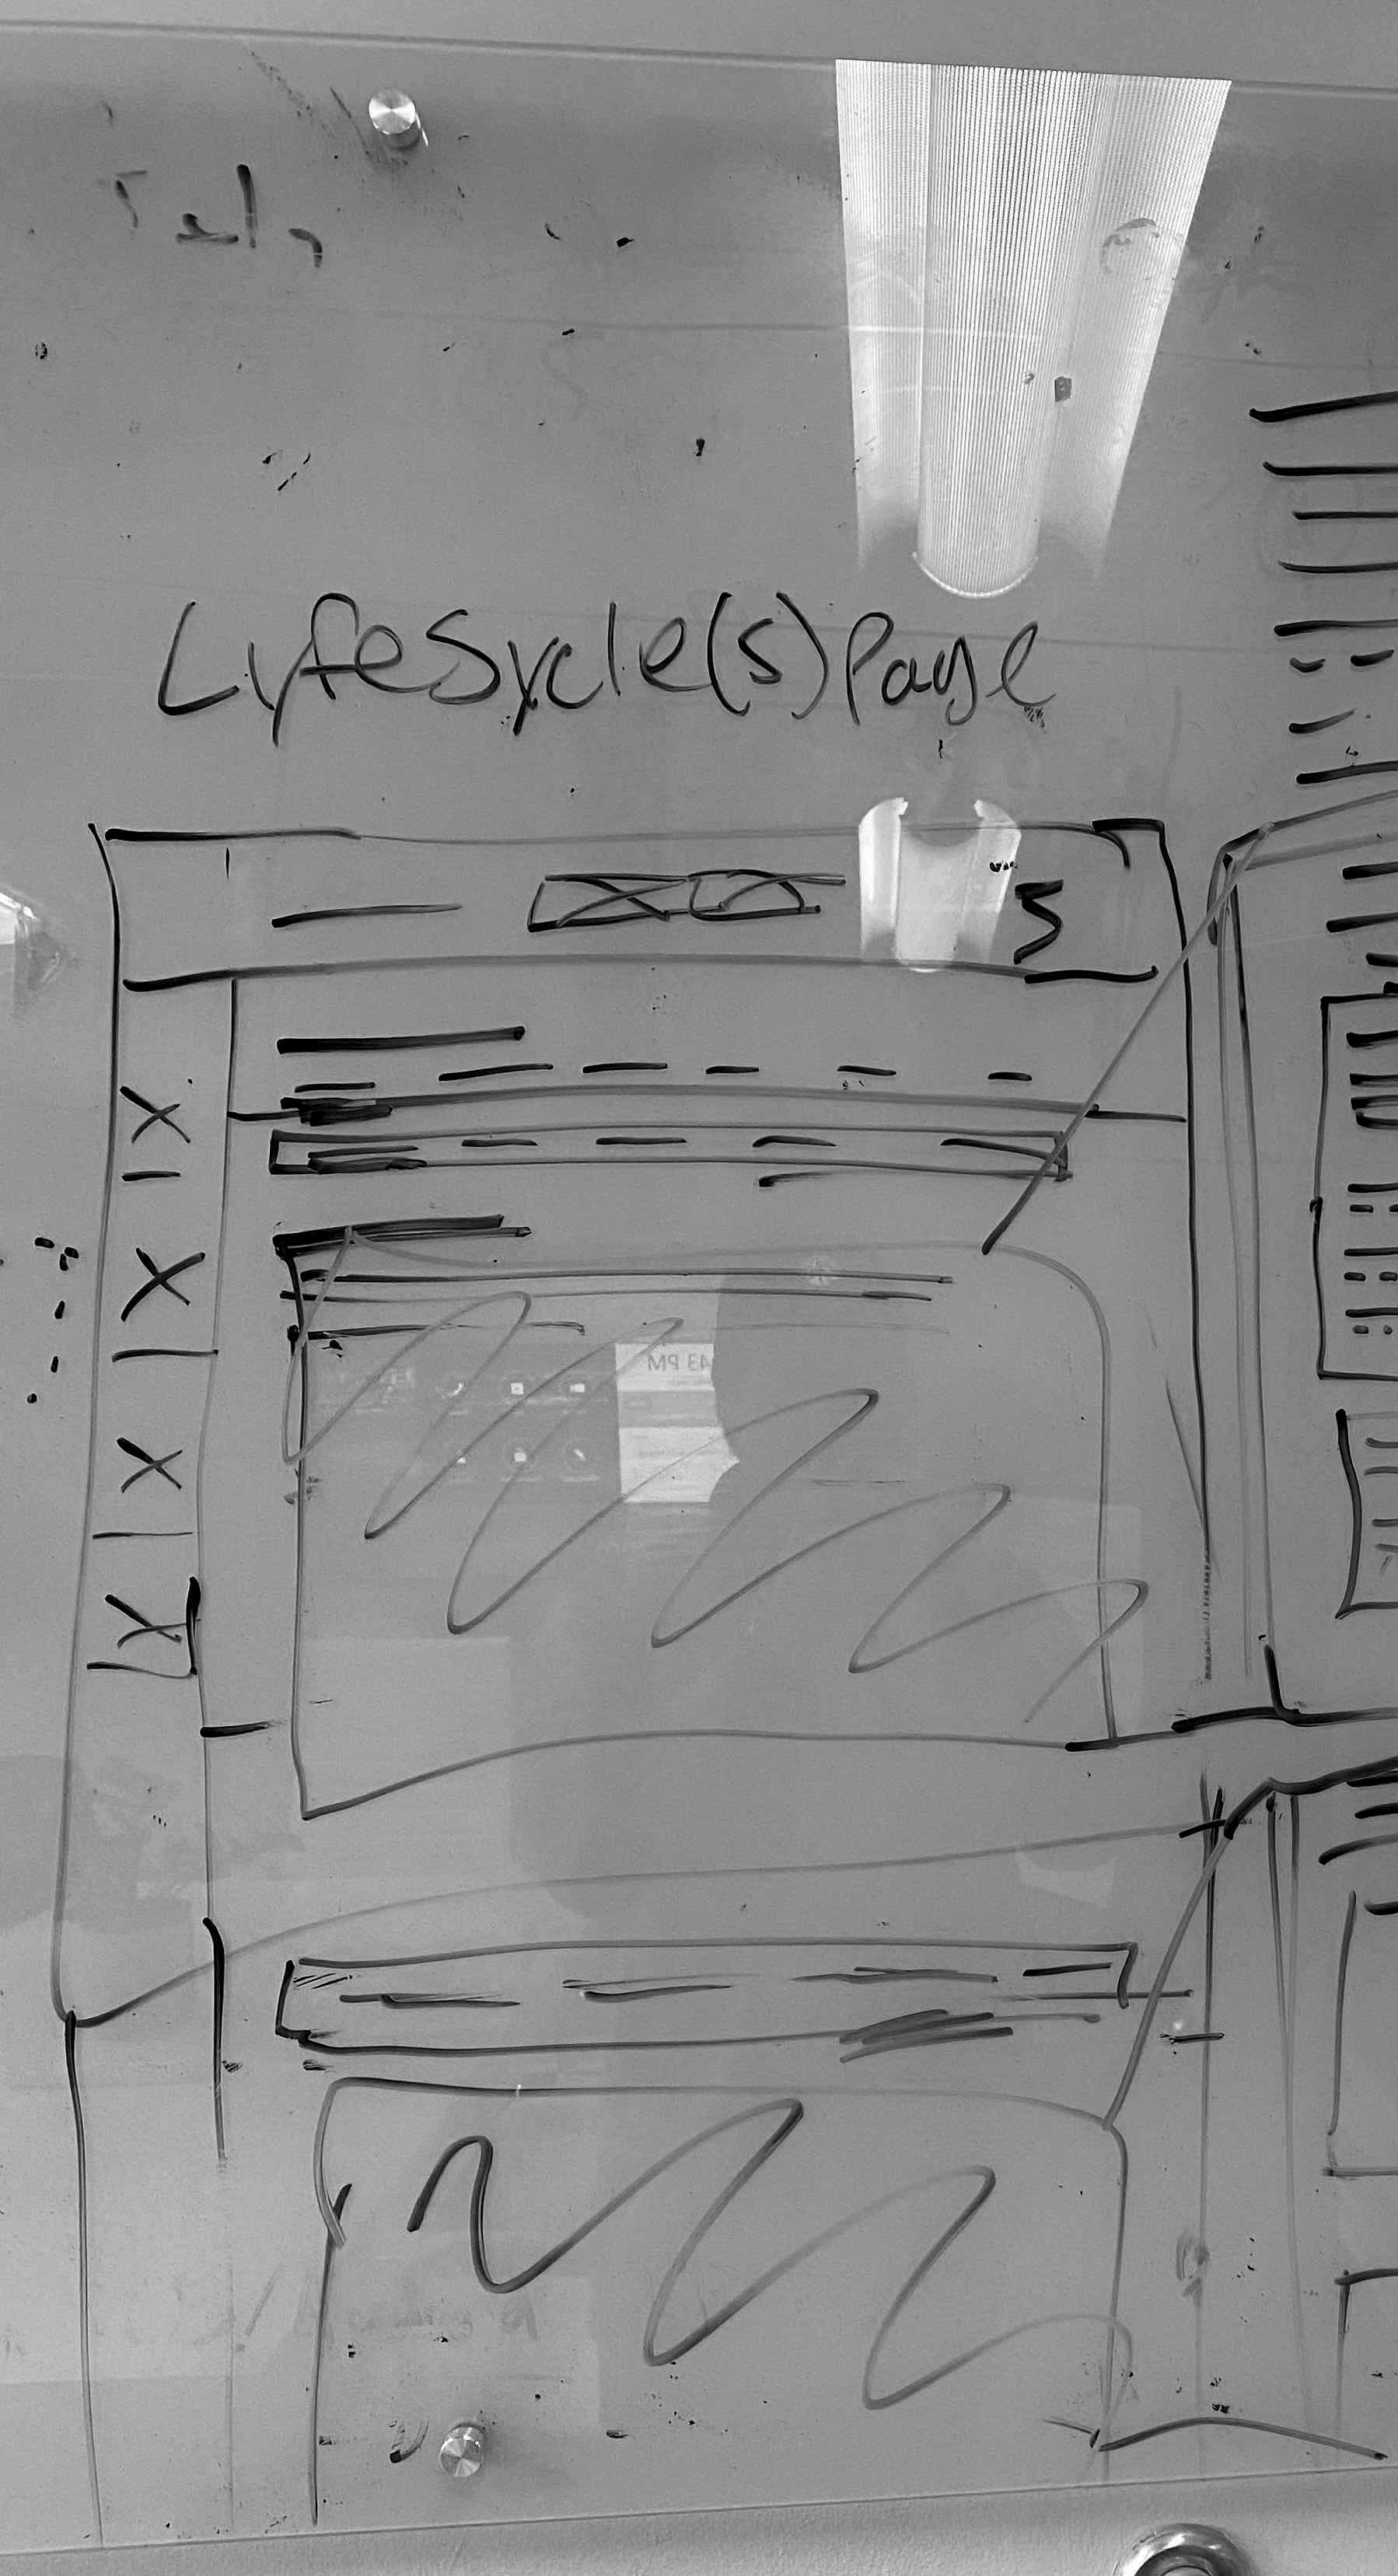
As the "lyfe sycles" (sic) wireframe on the right will show you, we had a lot of great ideas flow from our white-board sessions. I purposely kept the mood airy and light to make sure that we explored every option for displaying data to our users and that we didn't get too rigid into pre-defined paradigms (ones that were clearly not working, according to our user's feedback).
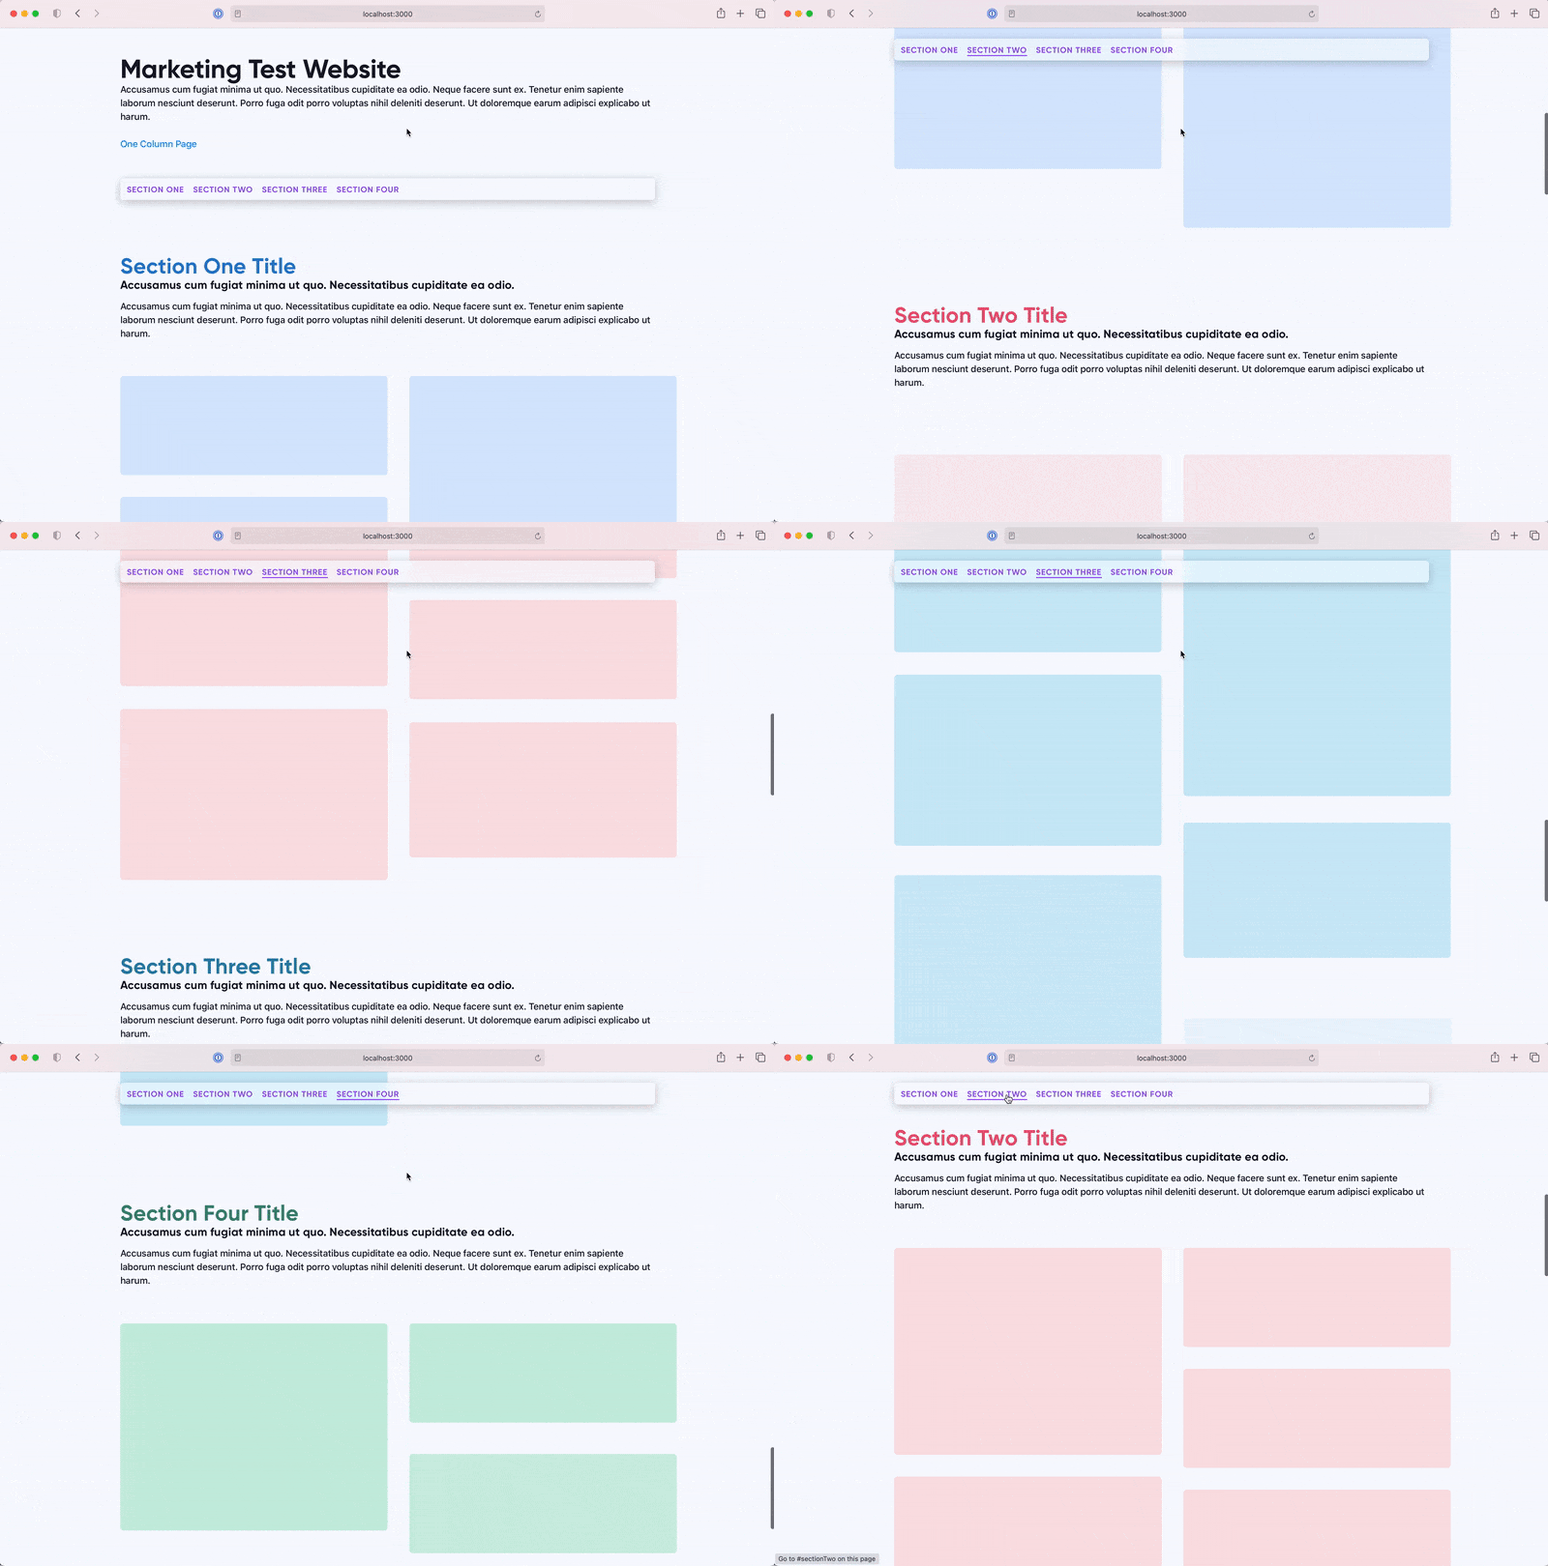
After we gathered our wireframes, I took them back to sketch to create low-fidelity mocks and then create interactive prototypes in HTML+CSS+JS. These prototypes allowed me to quickly and clearly explain both the interactions on the pages, and outline the exact expectations for layout and fluidity. These prototypes were handed off to stakeholders and engineering while I finished the high-fidelity mocks for final delivery. The intermediate step of real-ish example sites allowed the entire team to have a better understanding and shared vision for the final site – making the high-fidelity mocks an expected outcome to a shared vision.
Deliverables
As a dashboard is an evergreen project, there were less clear end points for final handoff. As I finished the first iterations of the pages, I would hand them off to the other members of the team as I worked on implementing new pages, or updating the global design system that was the foundation for the dashboard. I used the dashboard as a way to grow the other members of the team, allowing their ideas to be heard on a complicated project and encouraging them to follow the data to improve the designs against our assumptions.
My Roles
Product Design Lead
User Research Lead
Partners
Customer Success
Data & Analytics Team
Engineering Team
Platforms
Web